
Dartboards and Math Modeling: Where to Aim?
If you and your math-loving students are not already regular readers of FiveThirtyEight we highly recommend all of it including their weekly Riddler column .
This past week, riddlers puzzled over where to aim at a simplified dartboard in which the bullseyes, and the tripling and doubling rings are removed leaving twenty simply wedges. Assuming (and a big modeling assumption it is right off the bat) that you have a 50% chance of hitting the wedge you aim at, and 25% chances each of hitting either of the two neighboring wedges, what wedge should you aim at to maximize the points you expect to score?
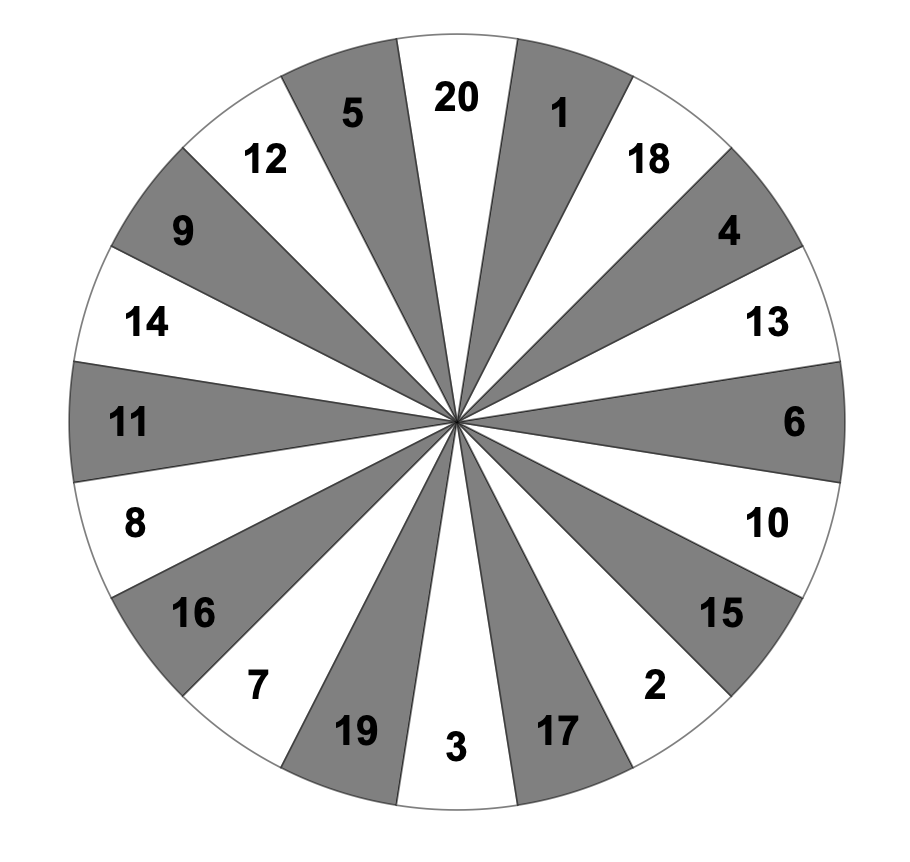
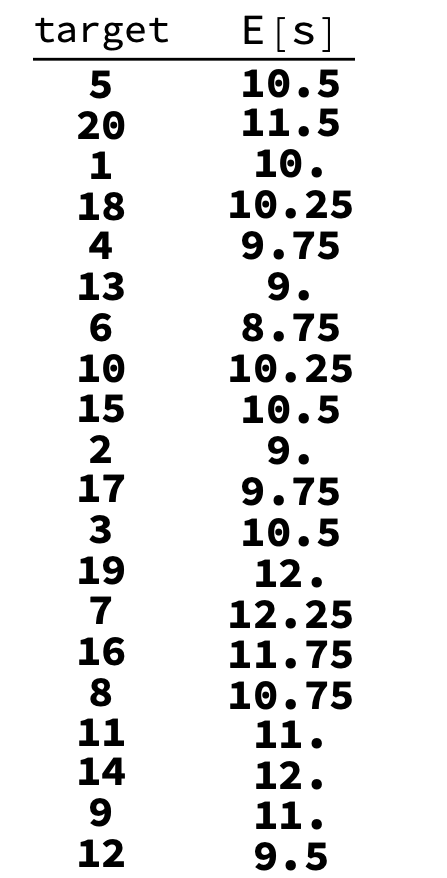
Given the setup shown in Figure 1, the problem is a nice exercise in applied probability and expected values, or weighted averages. For example, if you aim at the wedge worth 20pts, you would expect to score 20pts half of the time, 5pts a quarter of the time, and 1pt the remaining quarter of the time. Your long term average expected score would be E[s] = (.5)(20) + (.25)(5) + (.25)(1) which is 11.5. So you would average 11.5pts per throw.
Exploration
Could you do better by aiming at a different wedge?
Some students might argue that aiming at the 14pt wedge is better because it gives you the chances of scoring 9, 11, or 14 points, which on the whole seems better than having options of scoring 1, 5, or 20. After all, 11 + 14 + 9 is more than 5 + 20 + 1. But that assumes the probabilities of hitting each wedge are equal.
In the problem we’re given, you have better aim and so the central wedge needs to be weighted more heavily than its neighbors. So attention to this detail is needed; were you to aim at wedge 14, your expected score would be: E[s] = (.5)(14) + .25(11)+ (.25)(9) which is 12. Huh! Maybe the students are on to something since 12 points is better than 11.5 points. Then again maybe some more exploration is needed to test their intuition.
What about aiming for wedge 7? It brings wedges 19, 7, and 16 into play. Their sum is 42 which, besides being the answer to life the universe and everything, is also bigger than 11 + 14 + 9 = 34. And indeed, the expected score associated with aiming at wedge 7 is: E[s] = (.5)(7) + (.25)(19) + (.25)(16) which yields 12.25. Right again! These three wedges, with a larger sum, have a larger expected mean.
For a counter example to this apparent proportional relationship between the sum and the weighted mean of three numbers, have students focus on the situation involving aiming for the 3pt wedge. Its neighbors are the 17 and 19 point wedges. The sum of these three wedges is 39 but their weighted mean is only 10.5pts which is worse than the 11.5pts they could expect when aiming at the 20pt wedge which, with its neighbors 1 and 5, has a smaller sum of 26.
The Answer
If students systematically check all the options, they will find that indeed aiming for wedge 7 is optimal, but not because the simple sum of the three adjoining wedges is the greatest, it’s optimal because the weighted average is the largest. All twenty expected values are in Table 1.
Variations
What if your aim is better, or worse than hitting your target with probability .5? Does the best wedge change with accuracy? How? Let’s assume that you hit what you aim at with probability p and that you hit the two adjacent wedges each with probability (1 - p)/2.
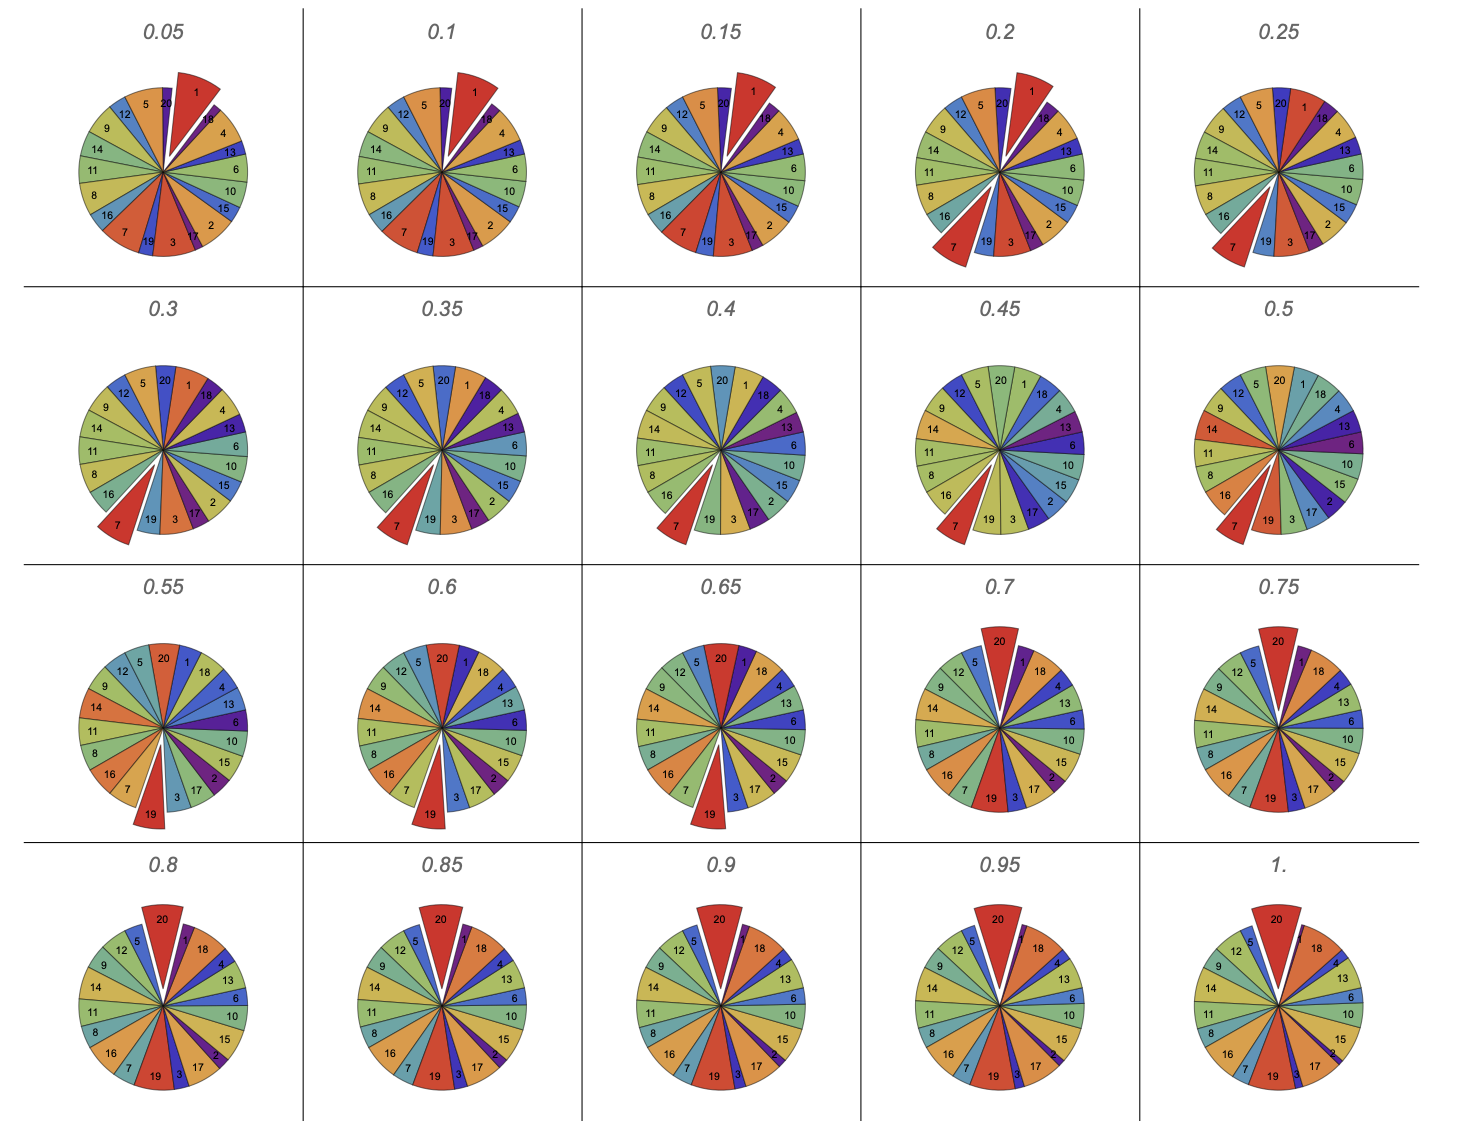
Figure 2 is a collection of twenty charts in which each pie chart is labeled with the probability of hitting the wedge you aim at and the areas of the wedges are proportional to the expected score associated with the wedge you aim at. The expected values decrease as the color shifts from red to purple. The best wedge (or wedges in the case of ties), that with the largest expected score, is indicated by pulling it slightly out of the rest of the pie.
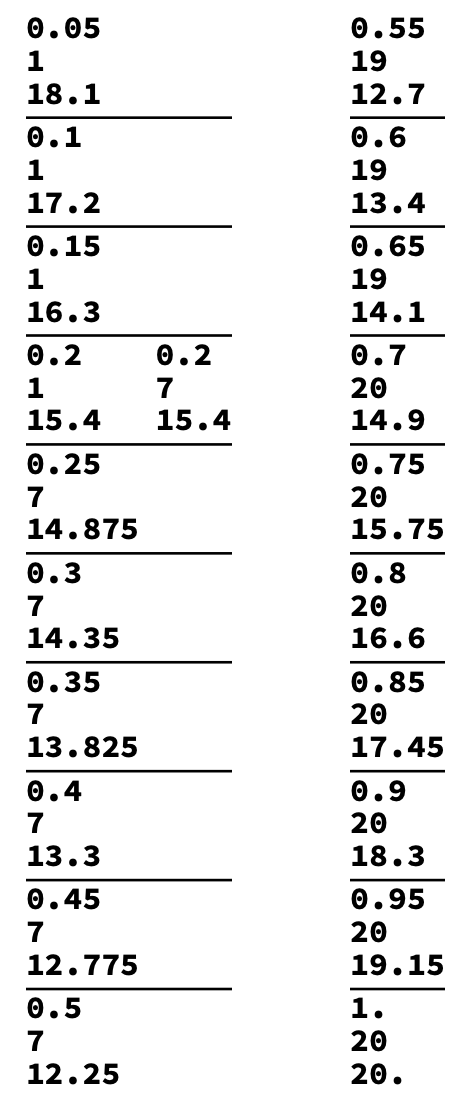
Table 2 shows results from varying the accuracy, each trio of numbers is in this order: the probability of hitting what you aim at, the best wedge to aim at, and the expected score. For example, the set of numbers {.15, 1, 16.3} means that if your accuracy is .15, then the best wedge for you to aim at is wedge 1 and your expected score will be 16.3. Hmm… if players play according to these optimal expected values, looks like a player with worse aim can do better than a more accurate player? More to explore!
Theory Meets Practice
This model is quite simplistic and theoretical. What happens in practice? Time for data collection in the form of playing darts! By collecting data from human dart players, students can develop a model based on empirical evidence. In developing their model they will encounter many complications, as is often the case when confronting reality. More assumptions will need to be made and much more will be learned along the way.
For students more interested in variations on the theoretical model, there are other ways to play with the problem. For example, what if the chances of what you hit involve more than the wedge you aim at and its two adjacent wedges? Students can adjust the expected value function to include more than those three wedges.
They can also make plausible assumptions about if and when the distribution of probabilities should be symmetric with respect to the central wedge. For example, when aiming at wedges near the 9 o’clock and 3 o’clock positions on the dartboard, is it more likely to miss below or above what you aim at? Or for wedges near the 12 o’clock and 6 o’clock positions, does being right or left handed result in a bias to one side or the other of what you aim at?
Plausible theoretical assumptions can be made and evaluated to see if there are any significant effects. If there are, then the more theoretically motivated students can partner with the more empirically oriented students and collaborate.
Happy modeling and do let us know if students develop interesting empirical models.
Written by
COMAP
The Consortium for Mathematics and Its Applications is an award-winning non-profit organization whose mission is to improve mathematics education for students of all ages. Since 1980, COMAP has worked with teachers, students, and business people to create learning environments where mathematics is used to investigate and model real issues in our world.