Math in Pictures: Fall Colors and Math
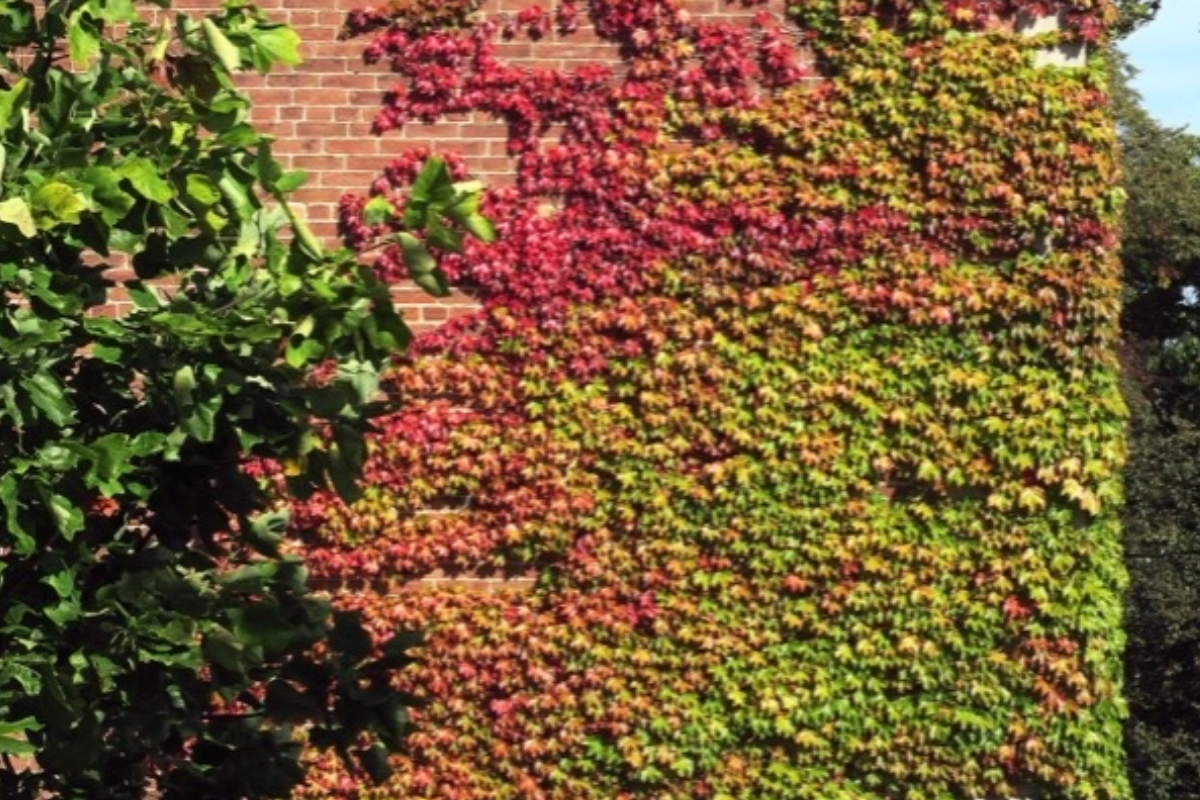
In this Math in Pictures blog we turn our attention to some Boston Ivy outside the window. Hard not to miss and hard not to think about it mathematically. In fact, several mathematical explorations come to mind: How many leaves are visible? What is the mass of the ivy? How much more of the building is covered since last fall? What area does the ivy cover?
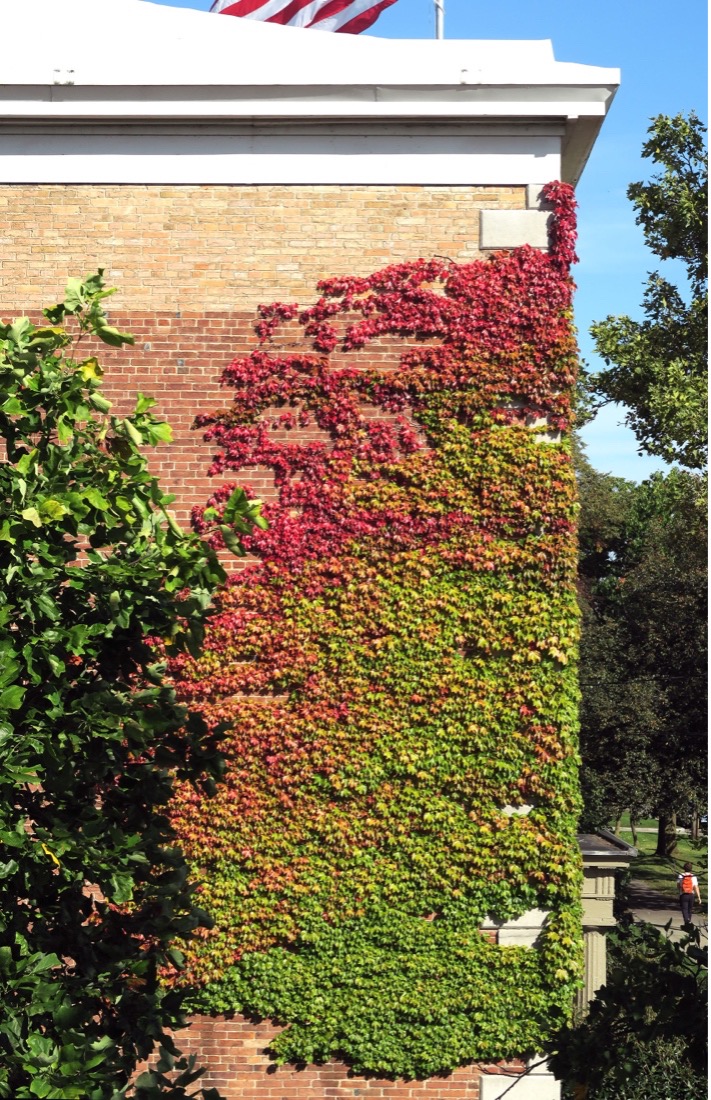
Students can pursue these and other questions; however, the one that caught our attention focused on the seasonal variation in the color of the ivy. There is a visible pattern in just this one photograph. Overall, apart from some local differences, the ivy seems to become progressively redder the higher up the building it is.
People create mathematical models for a variety of reasons including: describing, simulating, predicting, controlling, optimizing, and theory testing. Good models, in most every case, also depend upon some underlying understanding of the situation, an understanding that can be developed and improved through the process of mathematical modeling.
In the case of the ivy pattern, even if students fit a function to the data they generate from this photograph, the function by itself doesn’t explain the pattern. Students would need to integrate knowledge from other domains to hypothesize as to why the mathematical function they find is relevant. Other variables that might be at work include: temperature, age of vines, age of leaves, amount of sunlight, distribution of nutrients, and other micro-climate variations such as wind exposure. For the curious and detail-oriented student, the visible corner of the building is the southeast corner, the ivy is on a south facing wall.
Deciding on which variables to use in an explanatory hypothesis can be guided by first finding a function that relates “redness” to height. Students will need to develop a measure of redness to use in coding the leaves.
Hmm… looks like this pattern could be two-dimensional! How is the horizontal variation related to the vertical variation? But good beginnings are often simple beginnings. Different students could pick different vertical lines to develop models for and then perhaps combine their work.
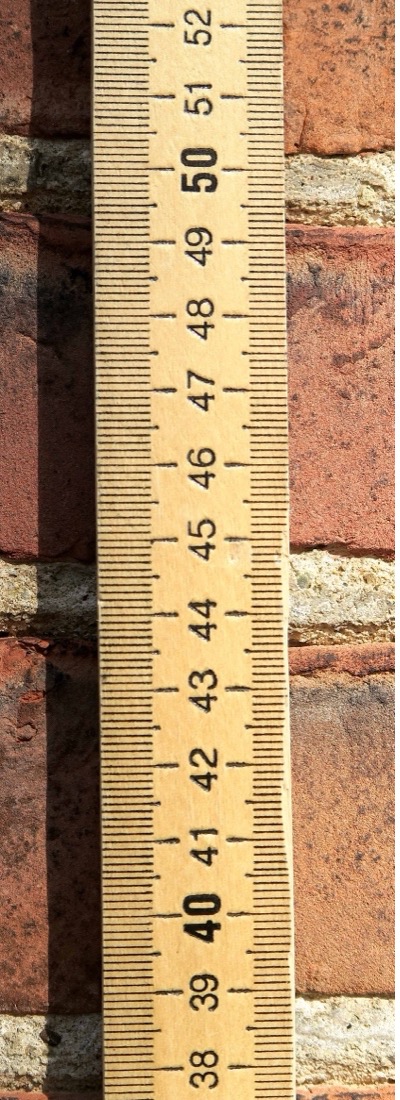
Below is a photograph of the brick wall and a meter stick to enable students to develop a scale if they want to work with the above photograph. However, we encourage them to find their own fall-color-math-in-a-picture modeling problem near them.
Send interesting student work to us at
Written by
COMAP
The Consortium for Mathematics and Its Applications is an award-winning non-profit organization whose mission is to improve mathematics education for students of all ages. Since 1980, COMAP has worked with teachers, students, and business people to create learning environments where mathematics is used to investigate and model real issues in our world.