Math in Pictures: Morphometrics with Fall Leaves
What can you do with fall leaves besides raking them? Math! Here is a simple hands-on introduction to morphometrics.
Taking a photograph and importing it into mathematical software, such as GeoGebra®, allows for some interesting explorations.

There are many mathematical questions to ponder as one contemplates fall foliage, for example, how many leaves are on that tree? Or what is the mass of leaves on a tree? What is the rate of leaf fall – what’s the graph of the number of leaves lost per day over the weeks it takes a tree to lose all its leaves? What is the most effective raking strategy? And so on.
However, this situation is ripe for a different sort of estimation problem and one that is more tractable, especially if a whole class of students gathers and pools enough data for a more confident analysis.
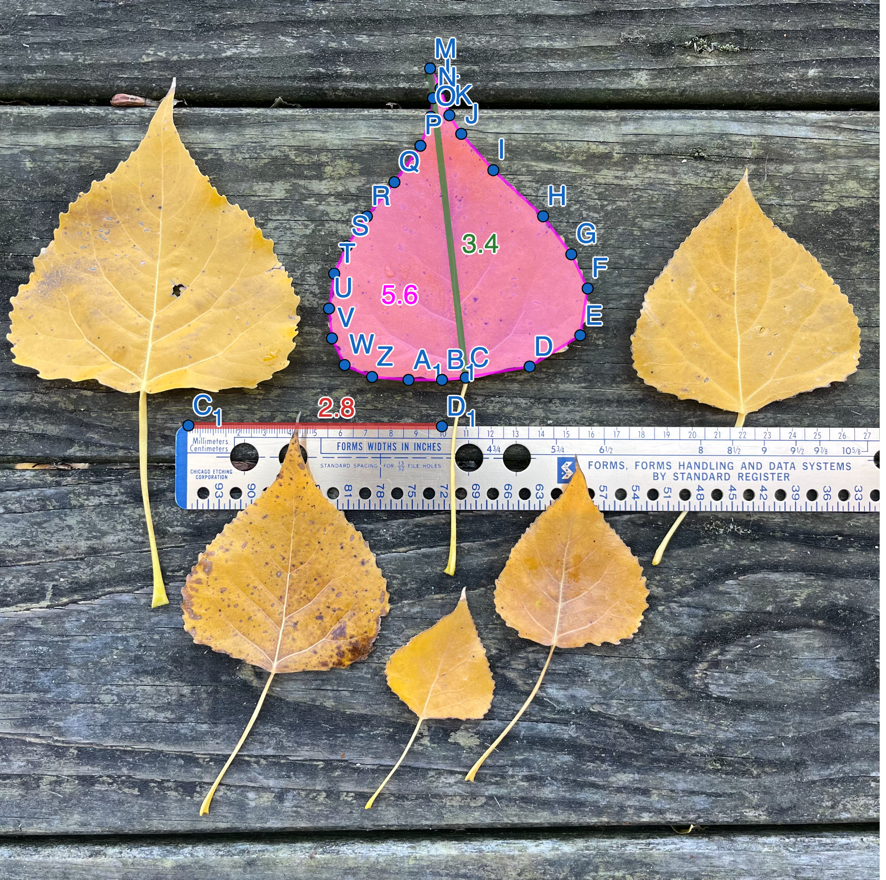
There are many ways to measure the area of a leaf, but one approach is to find a simpler measurement that correlates well with the area and allows for a very quick estimation of area. As just one example, and perhaps not the best, consider the distance from the tip of the leaf to where the stem meets the leaf. Could this one measurement be used to reliably estimate the area of the leaf?
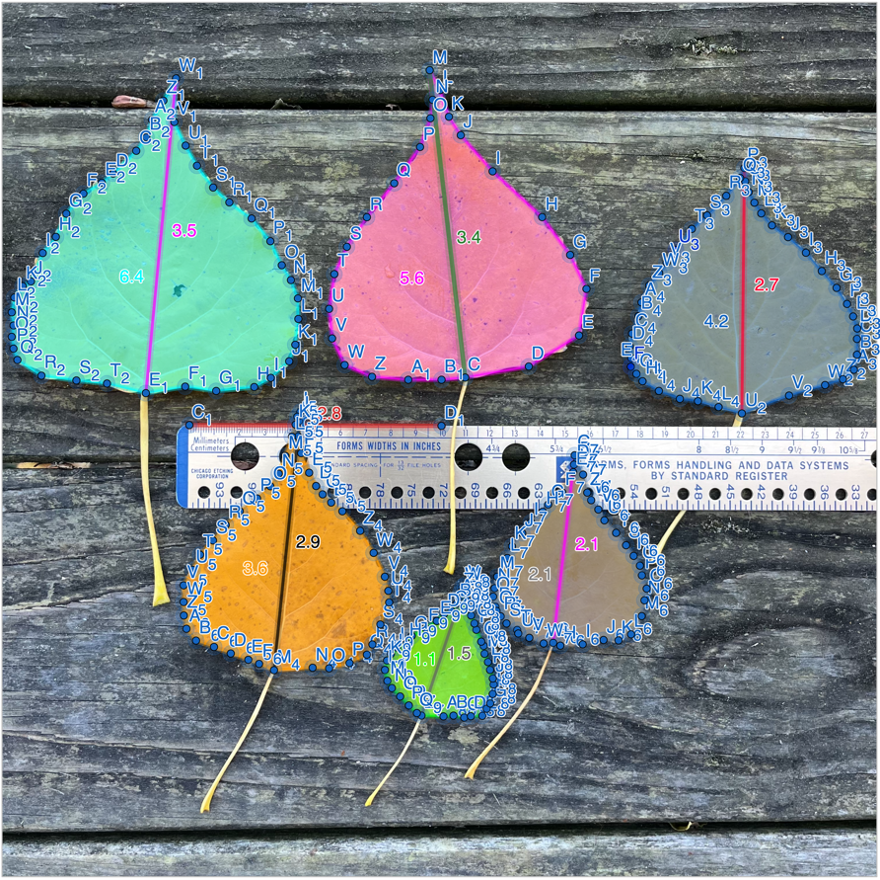
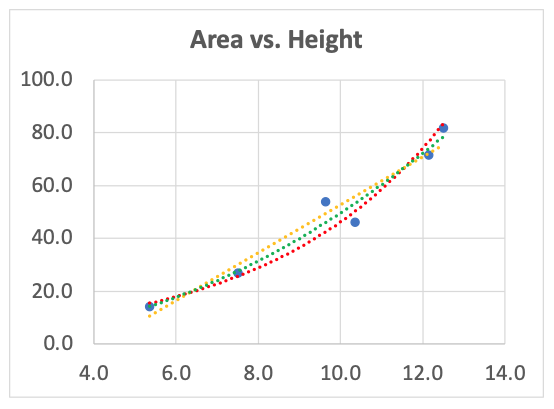
After a little (okay, a lot of quick) clicking we get the data in Figure 2. The six pairs of heights and areas, after conversion to cm and cm2, are: (5.4, 14.0), (7.5, 26.8), (10.4, 45.9), (9.6, 53.6), (12.1, 71.4), (12.5, 81.6).

To convert from the arbitrary units in GeoGebra to cm use a ruler placed in the photograph. Note that 2.8 units in GeoGebra are about 10cm in the real world of leaves, for this particular imported photograph. See the resulting graph in Figure 3.

This quick minuscule sample of six leaves is not large enough to pin down the relationship between cottonwood leaf height and leaf area. Can your class pin it down more precisely? But even these six leaves are suggestive – perhaps there is a good formula linking height and area. Students just beginning to model real world relationships with mathematics can use a spreadsheet’s built-in functions for finding lines of best fit. More advanced students can include confidence ranges and or explore how sensitive their model is to the identification of where the stem meets the leaf.
Hmm… I wonder if the relationship between leaf height and area varies by local climate; as you move north or south, will the same relationship hold? Oh, and what about elevation – how might that affect the relationship? Has the relationship changed over geologic time scales? And what about other species of trees? Or… And… Ah, but I guess I should actually rake some leaves now.
For students even less interested in raking and more into leaves or botany, below are some references. Of course, there is “an app for this” and the free software MorphoLeaf automates the computation and analysis of various leaf metrics. Although one could jump right to the use of the app, explorations of the underlying concepts and methods by hand serve a variety of valuable pedagogical purposes. Finally, note that there are unanswered research questions in this field that students could pursue with the help of software.
Written by
COMAP
The Consortium for Mathematics and Its Applications is an award-winning non-profit organization whose mission is to improve mathematics education for students of all ages. Since 1980, COMAP has worked with teachers, students, and business people to create learning environments where mathematics is used to investigate and model real issues in our world.
